CloudKarafka Monitoring Tools
CloudKarafka monitor your instances to have full insight into how your instance is doing and if anything might be failing and we also offer various monitoring tools. These tools will address performance issues promptly, before they impact your business. CloudKarafka monitoring includes diagrams for CPU, disk and Memory usage. It is possible to activate alarms to be triggered when a part of the system is heavily used and it is easy to view the Apacha Kafka log stream directly in Cloudkarafka.
Alarms
Available on CloudKarafka Dedicated
Receive accurate alerts based on performance anomalies in your application. It is possible to activate CPU, Disk and Memory alarms for your instance.
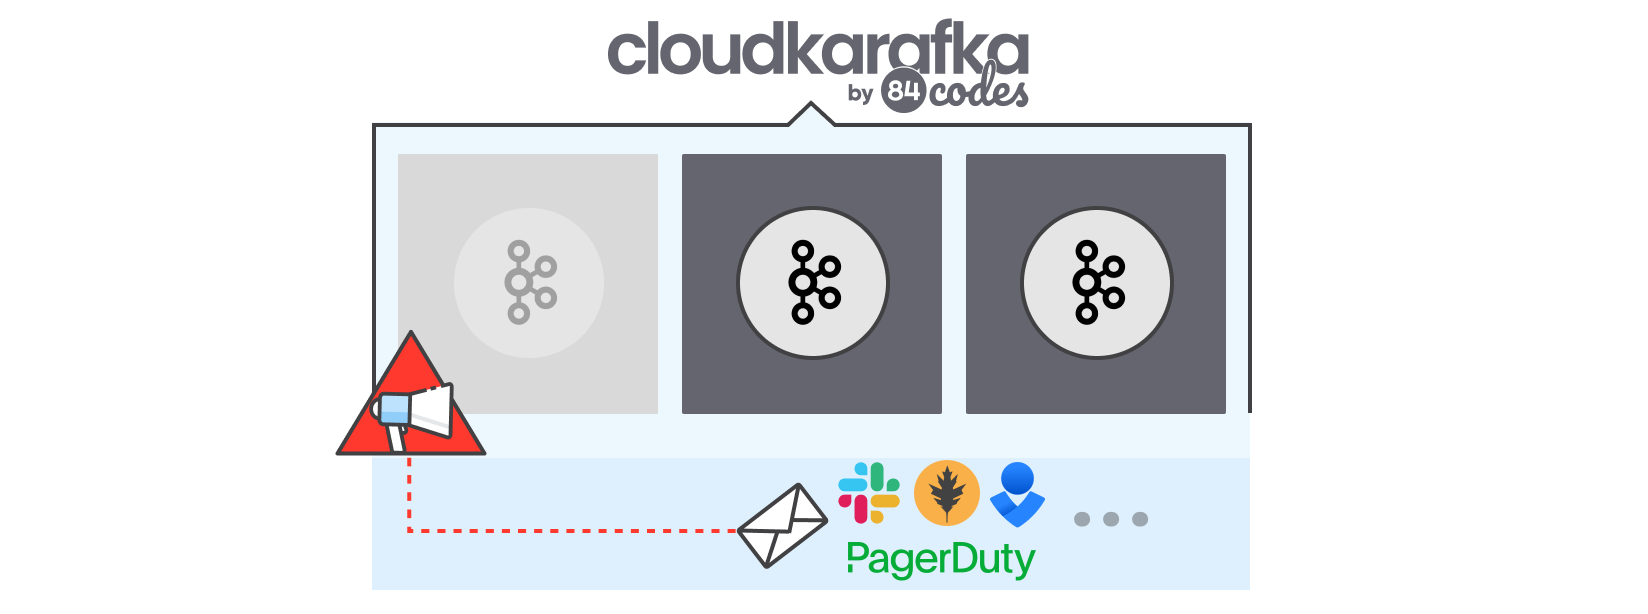
Alarms can be sent to email addresses, as push notifications to webhooks, to your slack channels, via direct integration with Pagerduty, VictorOps or OpsGenie. When an alarm is triggered will an alert be sent to everyone specified in the notification list. All alarms can be configured under the menu option Alarms on the Console page for your instance.
You configure CPU and Memory alarms by setting a value threshold and time interval. If CloudKarafka detects that the current usage of the server has met the threshold and kept that value for the interval you specified, CloudKarafka will notify you. The Disk space alarm requires an absolute number and it is the amount of free disk space that you set.
CloudKarafka will notify you once when the alarm is triggered and once again when the alarm has been resolved.
We highly recommend that you enable CPU, Memory and Disk alarms. Alarms can help you avoid downtime for your cluster, because it gives you the oppurtunity to detect errors before the cluster goes down.
More information about payload sent when using webhook can be found here.
Apache Kafka log and integrated monitoring services
Available on CloudKarafka Dedicated
CloudKarafka Log Stream show a live log from Apache Kafka.
Logs are a critical part of any system, they give you insight into what a system is doing as well what happened. You're able to ship your Apache Kafka logs from CloudKarafka dedicated instances to Papertrail, Splunk, Loggly, AWS CloudWatch Logs, Google Cloud Stackdriver Logging and Logentries.