Server metrics
Available on CloudKarafka Dedicated
CloudKarafka monitoring includes diagrams for CPU, disk and memory usage.
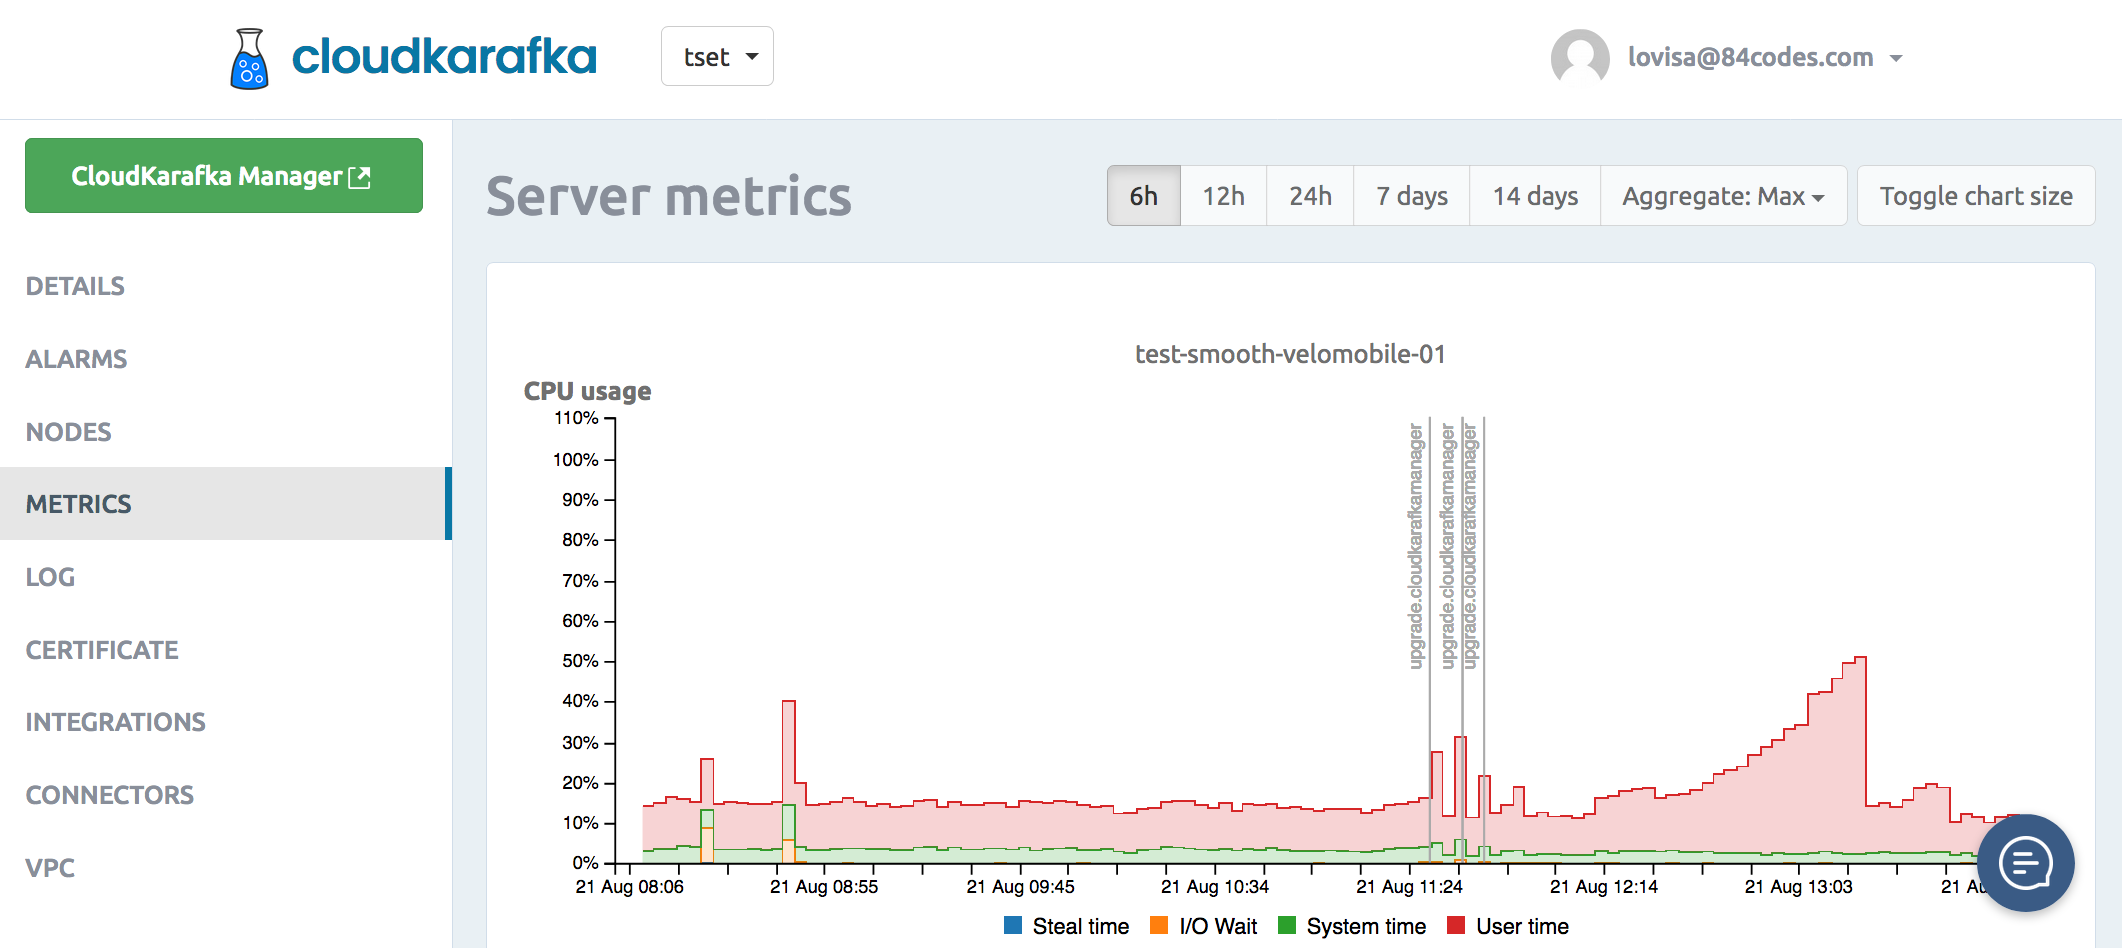
CPU Usage
CPU Usage refers to how much work your processor is doing.
-
I/O Wait:
Show percentage of time spent by the CPU waiting for a IO (input/output) operation to complete, the percentage of time the CPU have to wait on the disk.
-
User time:
Show percentage of time your program spends executing instructions in the CPU. In this case, the time the CPU spent running Apache Kafka.
If this is high it probably means you are on the limit of what your server can handle. You should consider upgrading before lack of CPU power becomes a serious issue.
-
System time:
Describes percentage of time the CPU spent running OS tasks.
-
Steal time:
Percentage of CPU time "stolen" by the virtualization system - time spent when the virtual CPU waits for a real CPU. If this is high it means that you are using to much CPU power. This can seriously impact the performance of your server. You should probably upgrade to a larger instance.
Memory Usage
- Used: Percentage of used memory.
- Free: Percentage of free memory.
Disk Usage
- Used: Percentage of used disk space
- Free: Percentage of free disk space
Notifications payload - webhooks
Alarm notifications can be received via webhooks. This section describes the content payload that is being sent to you in each POST.
- type: Type of the alarm, including one of: cpu, memory, disk
- appname: Name of the instance that triggered the alarm
- hostname: Hostname of the instance that triggered the alarm
- threshold: Value threshold specified for the alarm
- time_until_fire: Time threshold specified for the alarm
- account_id: Account id of the instance that triggered the alarm