CloudKarafka releases a brand new user-friendly Management Interface called CloudKafka MGMT. This improved interface lets you monitor and handle your Apache Kafka server from a web browser, in a much simpler way than previous versions.
Topics, consumers, retention period, users and permissions can be handled - created, deleted and listed in the browser and you can monitor message rates and send/receive messages manually.
In this blog post, we give you a short walkthrough of the different views that you can find in the new Apache Kafka Management Interface. Although, we strongly believe that you should log in and see it yourself. At the end of this blog post, you'll find instructions on how to enable the Kafka MGMT on your cluster.
CloudKarafka Manager is shipped with a Kafka plugin called 'cloudkarafka-metrics-reporter’. The plugin continuously collects metrics from your Kafka cluster and saves it persistently to a seperate Kafka topic. The plugin makes it possible to keep track of the health of the cluster, to retrieve historical data and render beautiful graphs - with no interruption. All data is requested and collected via the http-api that is used in the communication between the app and Kafka + Zookeper. The app itself is running locally in Go’s runtime system and is accessible through your web browser.
Apache Kafka Management Interface walkthrough:
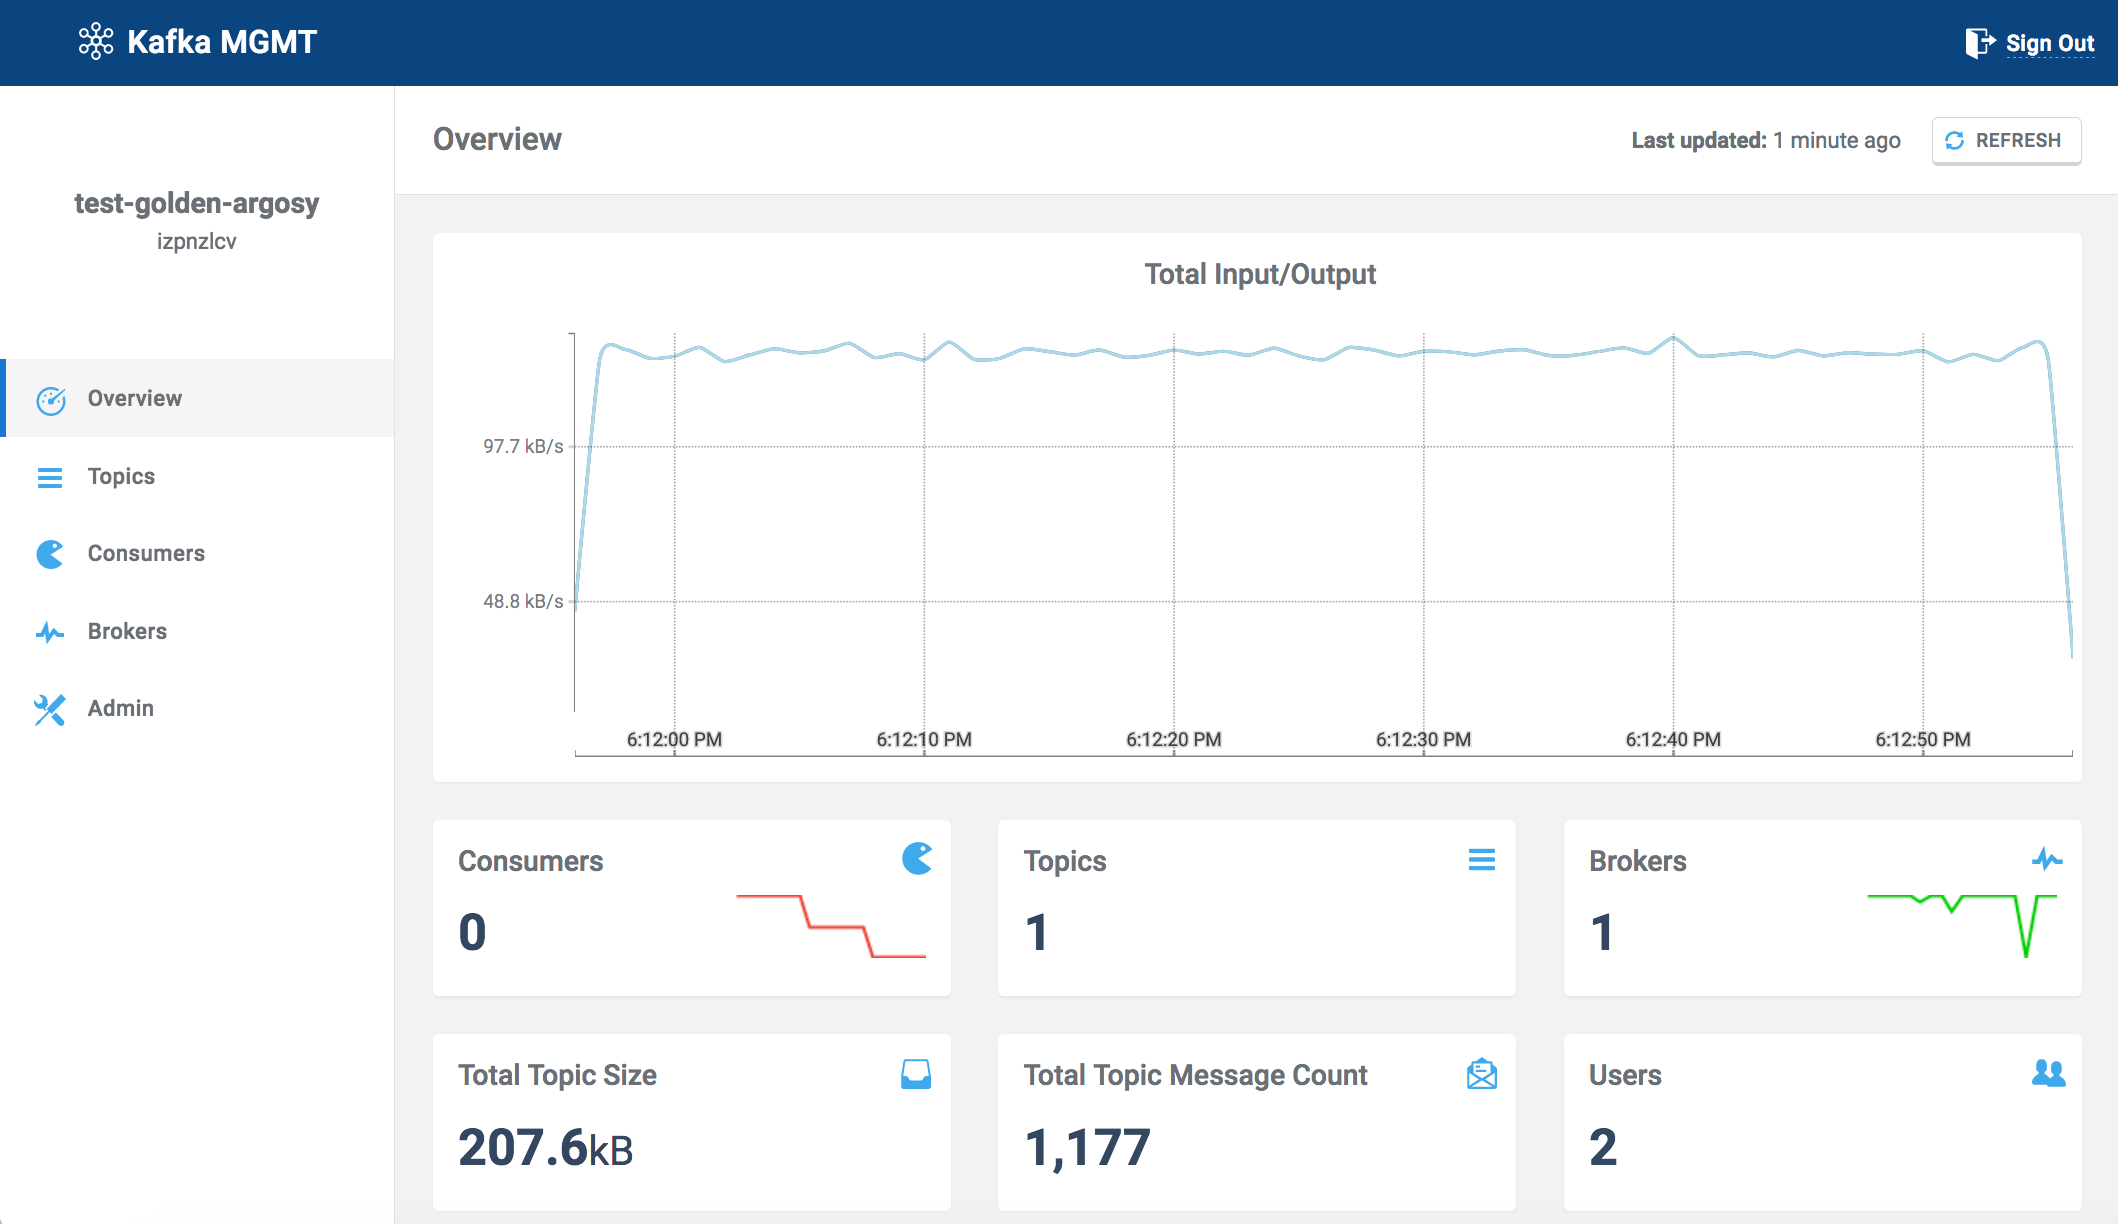
Overview
Monitoring has never been easier. Here you'll find a graph, showing the latest input/output of messages from and to your cluster, making sure that your setup is running smoothly.
You also get a quick overview of numbers of consumers, topics, brokers, users and you can see your total topic size and total topic message count.
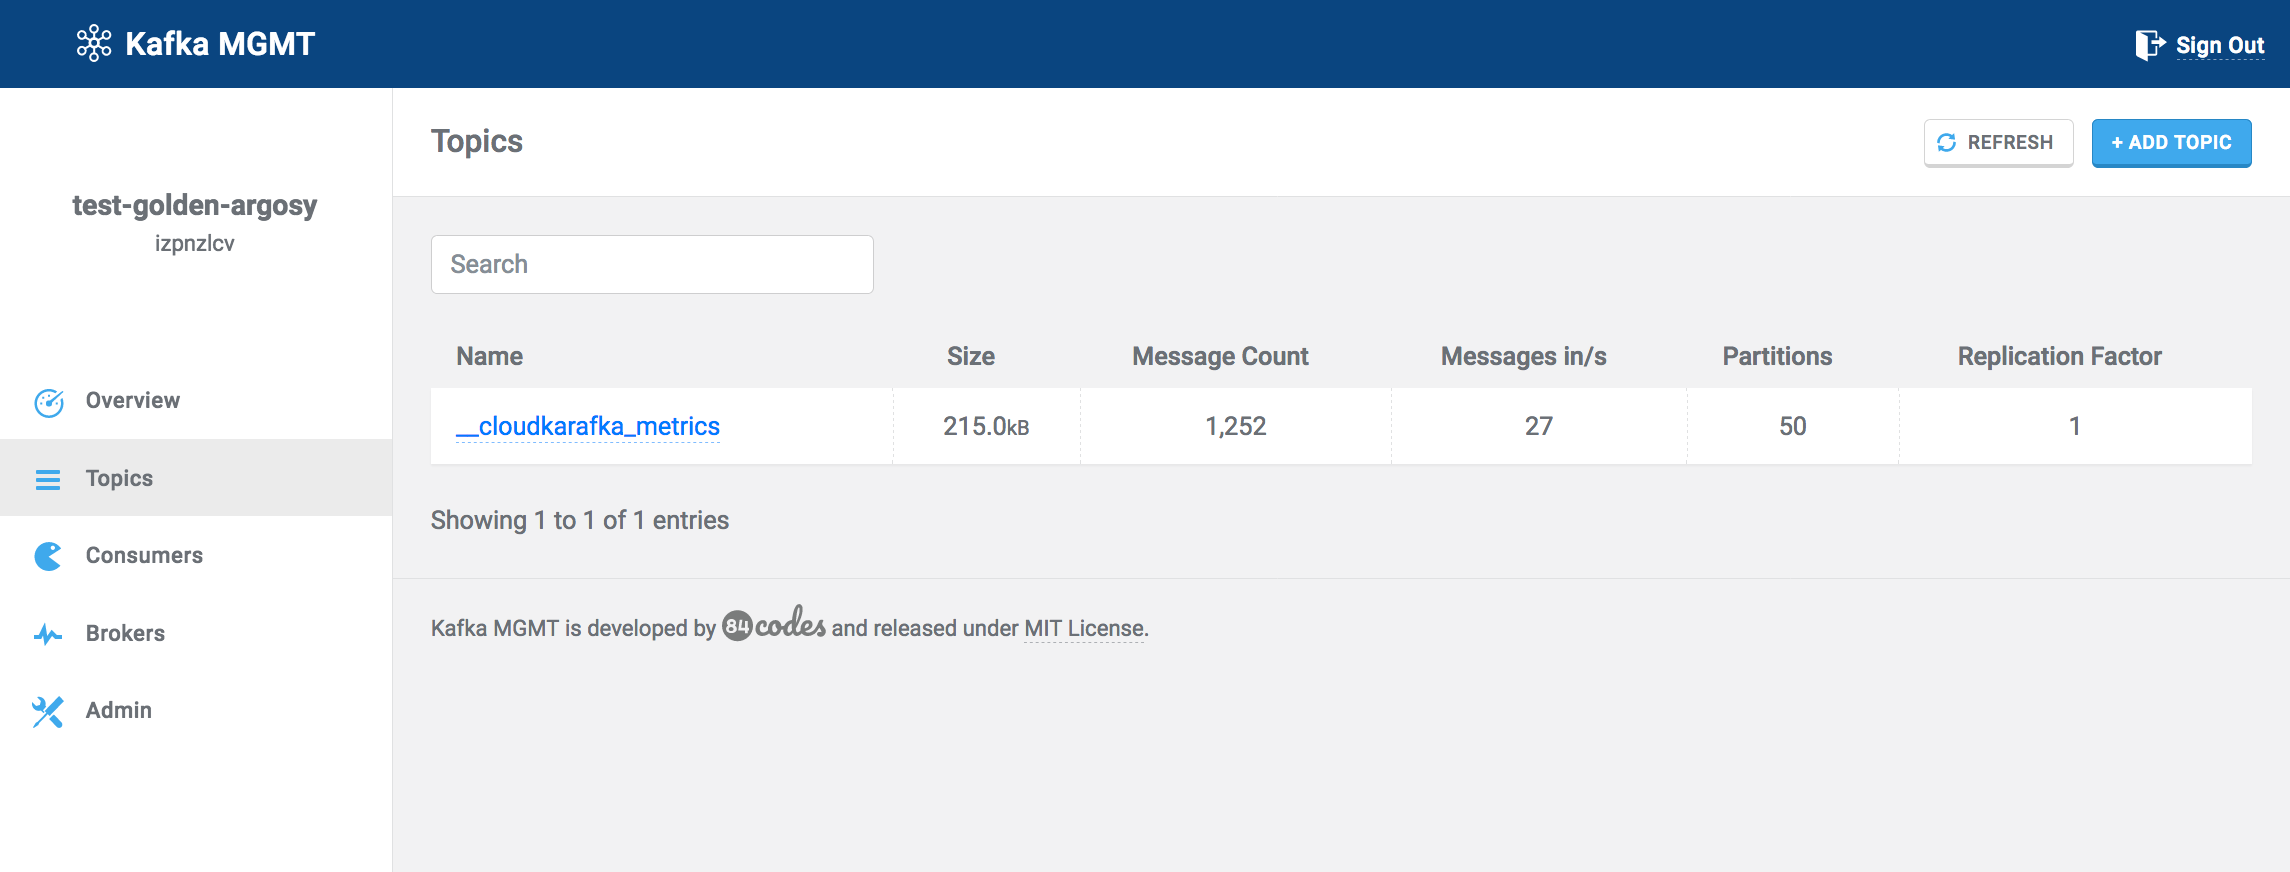
Topics
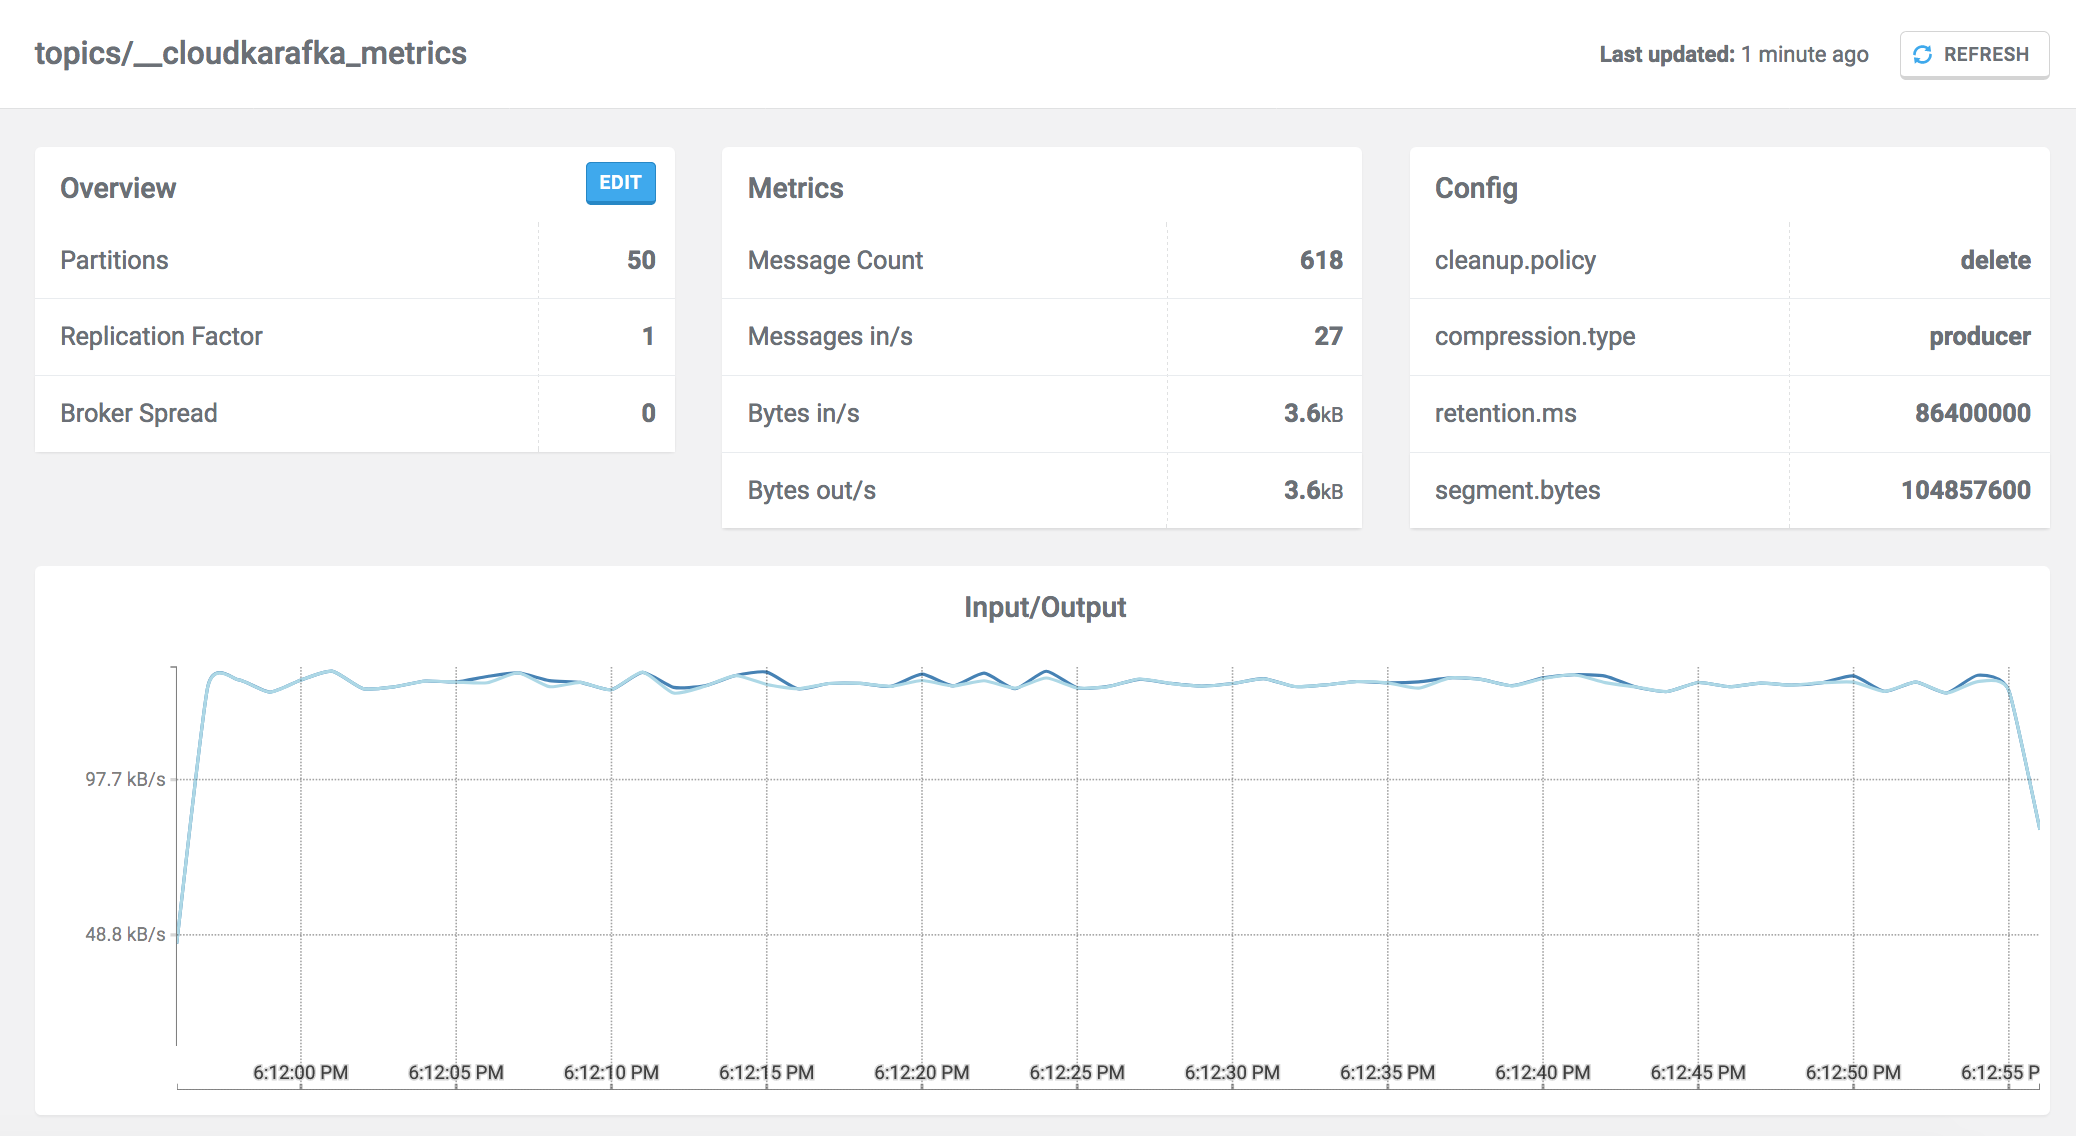
Topics are categories or feed name to which messages in Kafka are published. We have now made it very easy to create and delete topics from the new management interface. You can also view message rate for a specific topic.
Following settings can be defined when adding a new topic to your cluster.
- Name
- Number of Partitions
- Replication Factor
- Topic Configuration
Consumers
Consumers show the consumers that are connected and which topics they are consuming from.
Brokers
The broker tab show endpoint information about your brokers, Kafka version of the broker, uptime for your server and message flow in the broker. You can find more information about Kafka Broker in a current blogpost here.
Admin
Under Admin, you get to interact with your cluster by adding users and edit user permissions. You are also able to change topic ACL, cluster ACL and Group ACL which gives you the opportunity to affect and steer your setup.
How to enable CloudKafka MGMT
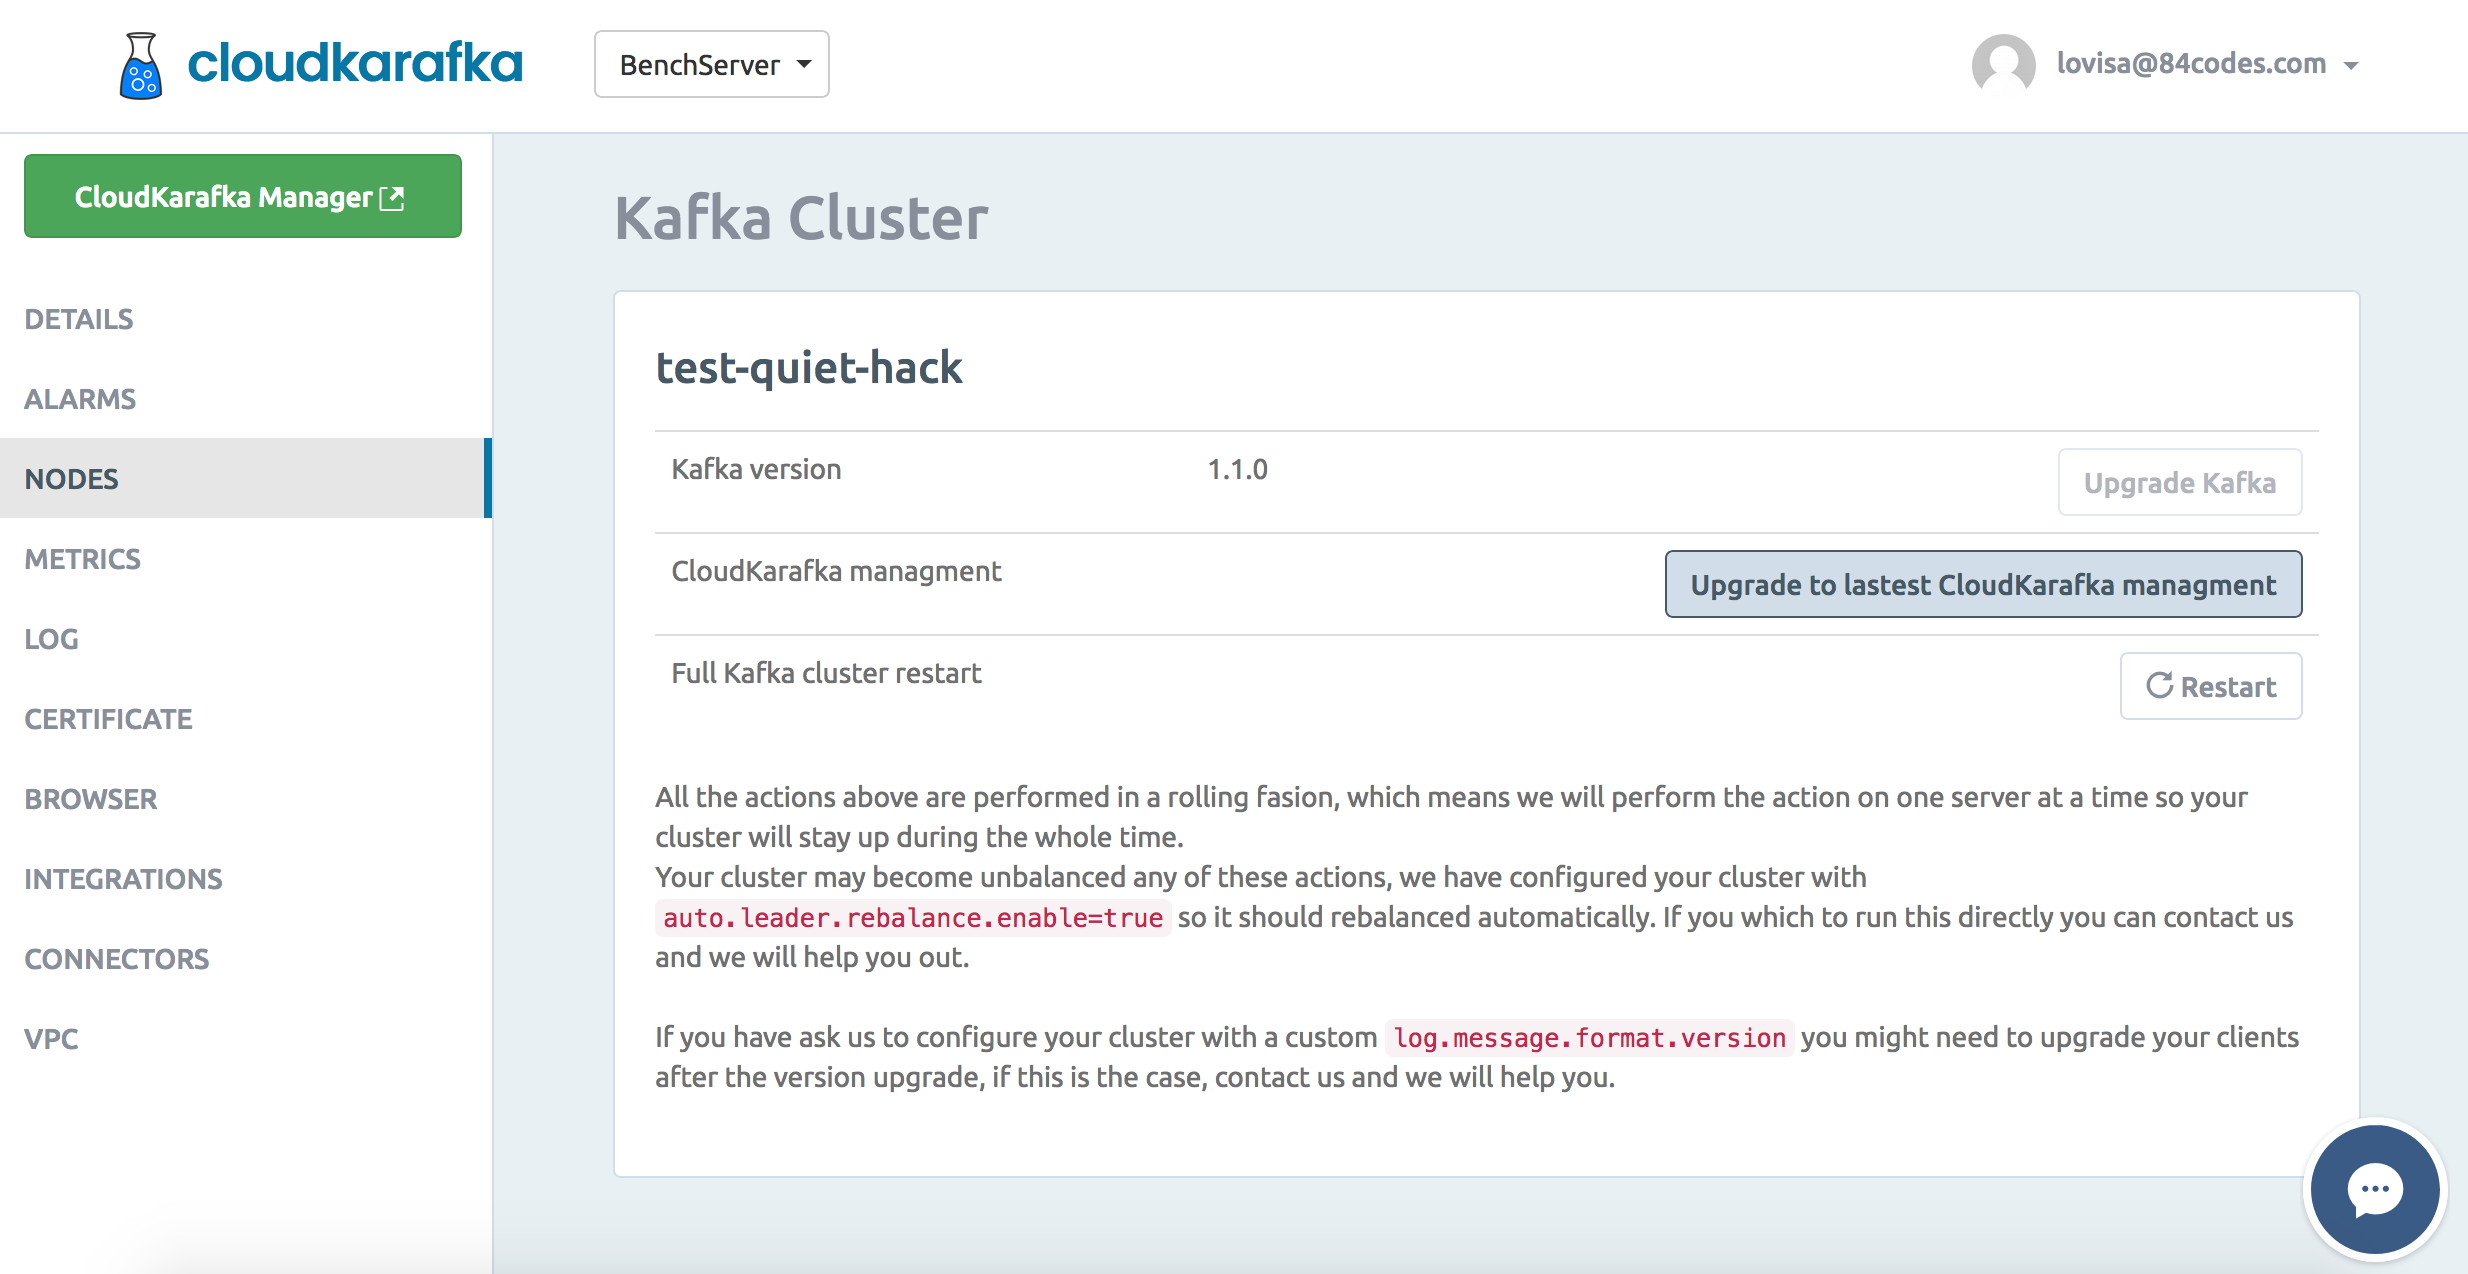
CloudKafka MGMT interface is enabled by default on all new clusters, including shared
clusters (developer duck). The Kafka management interface is not enabled by default on clusters created before today. You can enable the plugin via the control panel, enter the nodes tab and press “Upgrade to latest CloudKarafka management”. A restart of the cluster is required after you have enabled the management.
Does the management put any extra load on the server?
The management interface is safe to enable, and it does not put any extra load on the server.
Kafka MGMT as Open Source under the MIT License
We are happy to tell you all that Kafka MGMT will be released as open source under the MIT License. More information to come!
And as always, feel free to send us any questions or feedback you might have at support@cloudkarafka.com